


Causal Loop Management | Customers, Etc.
Introducing causal loop diagrams as a simple way to model systems
This is the 3rd post in a series on Revisiting Systems Thinking.. The most recent post was Pushing (Job) Boundaries.
Early in my career as a manager, I remember occasionally needing to coach a team member to bring problems to me if they got stuck. If they kept it to themselves or shared it with someone else, the problem would very likely get worse. And if I didn’t know about it, I couldn’t help them.
This is part of why one-on-ones are so important. As Andy Grove writes in High Output Management:
At Intel, a one-on-one is a meeting between a supervisor and a subordinate, and it is the principal way their business relationship is maintained. Its main purpose is mutual teaching and exchange of information. By talking about specific problems and situations, the supervisor teaches the subordinate his skills and know-how, and suggests ways to approach things. At the same time, the subordinate provides the supervisor with detailed information about what he is doing and what he is concerned about.
But what happens if you don’t address their concerns?

Stocks, Flows, and Feedback Loops
A few years ago, when I first started writing about systems thinking, I created diagrams based on what I read in Thinking in Systems, like this:
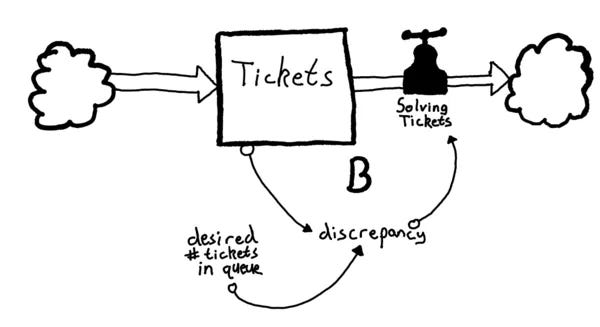
This type of system diagram, I learned later, is called a “stock and flow” diagram. Having stocks, flows, and feedback loops are requirements to make a complete system, at least according to Thinking in Systems. But it can feel complicated to get all of the pieces into place. Sometimes you want a simpler approach so you can identify the feedback loops and quickly visualize the basics of the systems.
For an approach to modeling systems that’s a little more basic, let’s look at causal loop diagrams.
Causal Loop Diagrams
I stumbled across causal loop diagrams while searching for visualization tools to model systems. The article, “Causal Loop Construction: The Basics”, provides a helpful primer.
With Causal Loop Diagrams, instead of worrying about stocks and flows, we’re going to instead worry about the events of a story, the links between those events, and the types of feedback loops they create.
Let’s model our example of one-on-ones using causal loop diagrams1.
Alerting the manager to a problem
To start, let’s start before the one-on-one happens. The team member has a problem.

Next, let’s add how the team member feels when they have a problem.

Now we need to connect the two events. When we connect them, we need to say if the link goes in the same direction (+) or in the opposite direction (-). Links that go in the same direction increase the thing being linked whereas links that go in the opposite direction decrease the thing being linked.

In this scenario, we’re saying that when a team member has a problem, that increases the team member feeling bad. More problems, more bad feelings. Simple enough so far.
Now let’s add an event where the team member talks to their manager2. Because this is still happening in the same direction, this is a “+” link.

What happens to the team member’s feelings when they’re able to get a problem off their chest by telling their manager? They probably feel better (or “less bad”) because the response from their manager helped them feel heard. We might model that like this:

Note the “-“ in the return link. This is because the action from the manager opposes the action that came in, which results in less “TM Feels Bad”.
Now we can label the loop. Because the goal of this exchange is to reduce “TM Feels Bad” to zero, this is a balancing feedback loop.:

To really complete the loop, the manager needs to address the underlying problem. We model it like this:
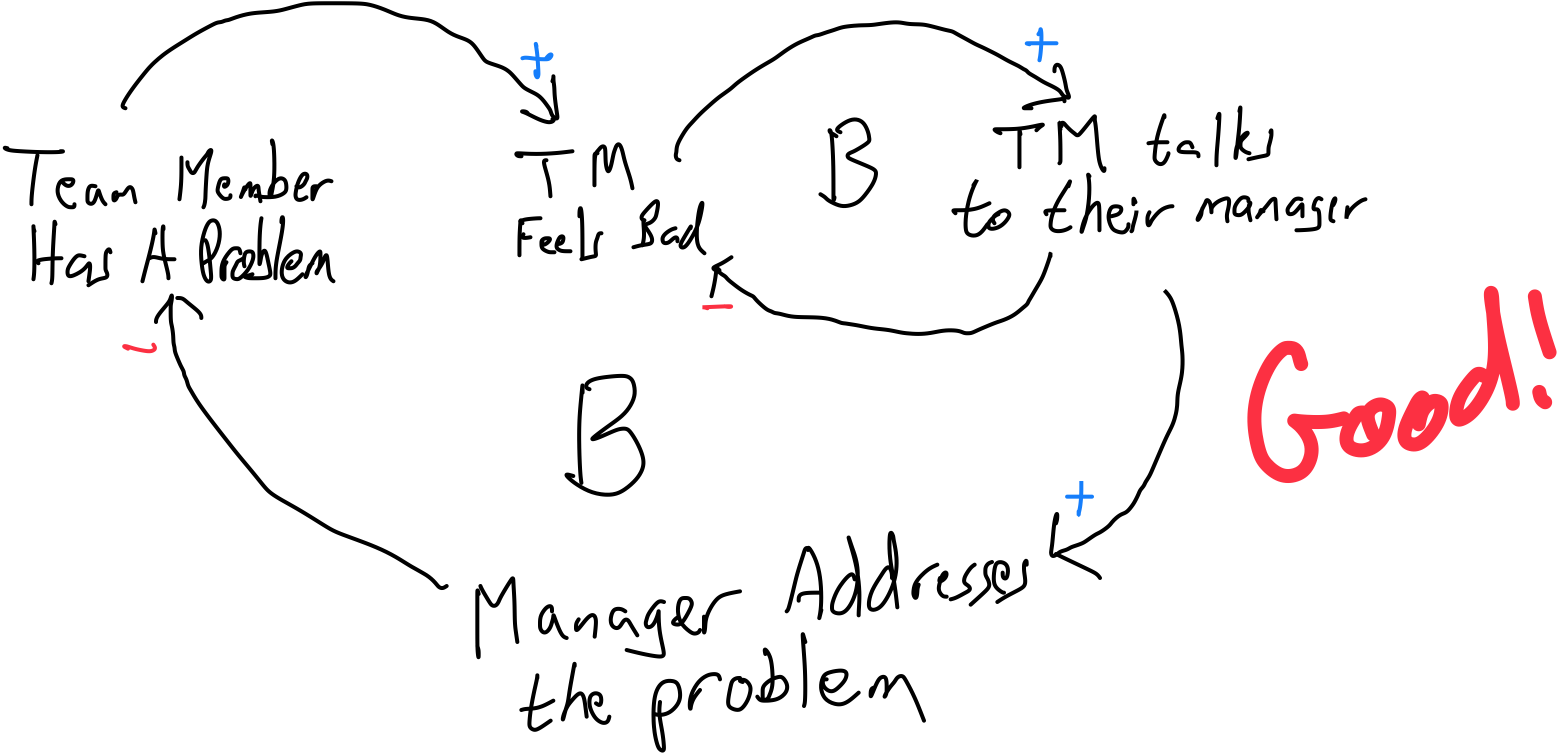
You’ll notice that because the manager addresses the problem, that reduces the “Team Member Has a Problem” activity. This creates an overall balancing loop where the number of problems goes down to zero and the team member feeling bad also goes down to zero. This is good!
But what happens if the manager neglects to address the problem?
Flipping the feedback loop
When we change the activity from “addresses” to “forgets”, we flip the polarity when we get to the end of the loop, going in the same direction to amplify “Team Member Has a Problem”.

With polarity flipped, what had been a balancing feedback loop is now a reinforcing feedback loop:

What does this mean? Because we’ve introduced a reinforcing feedback loop, this means that the loop is going to keep growing and growing until some new force acts on the systems. Not good!
The presence of the balancing feedback loop is interesting here. It still feels good for the team member to talk to their manager, so “TM Feels Bad” goes down a bit, but as problems continue to be neglected, the reinforcing feedback loop will begin to dominate.
Talking to a peer
What’s the team member going to do in this kind of situation? One thing they might do is talk to a peer:

What’s happening here? When the team member isn’t feeling heard by their manager, they decide to talk to their peer instead. And just like talking to their manager, it feels good! This is why there’s a balancing feedback loop back to “TM feels bad”. As the team member gets stuff off their chest, they feel heard and therefore “less bad”.
Notice the manager is off to the side and doesn’t know about the problem. Poor manager.
The problem with this model is that the peer isn’t able to address the underlying problem:

Because the peer can’t address the problem, the problem persists, creating a reinforcing feedback loop where they continue to feel worse and worse, which causes them to talk more to their peers to try to feel better, but which doesn’t actually fix the underlying problem, which repeats the cycle.
Note that this has the exact same effect as the team member talking to their manager and their manager not doing anything about the problem.
Talk to your manager
From a systems perspective, this is why we report problems to our manager. We want to feel heard—this helps us feel better about the problem in the short term—but we also want to know the root problem will get addressed by our manager.

Causal Loop Diagrams vs Stock and Flow Diagrams
Causal loop diagrams provide us with a simple tool for visualizing feedback loops and thinking through how we might effect change on the system. While they might not be as “feature complete” as stock and flow diagrams, they’re much easier to “just start”, and they can be converted to stock and flow diagrams if the need arises.
Diving into systems thinking and using tools like causal loop diagrams can seem daunting at first, but there's immense value in simply starting. Don't wait for perfection; begin by sketching your understanding, however rudimentary. As you map out relationships and interactions, clarity will follow. The first step is to begin. Grab a pen, visualize your system, and let the insights emerge.
Thanks to my wife, Emily McCormack, for giving me the topic to write about this week. I was sharing with her how I wanted to model causal loop diagrams but couldn’t think of a scenario, and she came up with the idea of modeling what happens when a direct report doesn’t talk to their manager and instead shares problems with their peers. Thanks Emily!
Caveat: the models here are rough sketches and probably leave a lot of room for improvement. Someone might look at my diagrams and say “you have verbs where you should have nouns!” If you’re that person and have expertise, would you please reach out? I’m trying to learn more about this topic.
Still, I think the process of roughly sketching models is helpful, even when it’s not perfect.
This graphic could probably be improved. “TM talks to their manager” should really be something like “Informed Manager” and the link is where the talking happens. It’s a rough sketch!