Modeling the Support System
This is the 2nd post in a series on support systems, which began last week.
The next post in this series is Modeling the Support System in HASH.
Last week’s post, which was about building your first support model, talked about the importance of having a model for customer support, or more precisely, we focused on how to think about hiring for customer support. The situation we were looking to avoid was one where a solo agent gets burned out through no fault of their own except for the fact that the number of support tickets is growing beyond what they can handle. Having a model helps to prevent that.
We also built the model into a spreadsheet, but this week we’re going to try to take a different perspective that gets us to visualize the system of support. Learning to understand and visualize the system can help us find creative ways to make the system more robust without necessarily needing to hire more people.
Photo by Joey Kyber on Unsplash
Thinking in Systems
Before we go any further, I want to point out that I’m borrowing concepts that I’ve learned from Thinking in Systems by Donella Meadows. I highly, highly, highly recommend this book, which provides the language I’ll be using to talk about systems. To keep the newsletter readable, I’m not going to point to specific chapters or pages in the book, but know that you can always dive deeper by picking up the book.
Stock
The foundation of a system is a stock. A stock of what? It could be anything, but in the case of our support system, the stock is customer support tickets. This is the reason our solo support agent from last week was hired, namely, to make the stock of open customer support tickets go to zero. Let’s model that by drawing a box to represent the stock:
Not much happening
But where do tickets come from? For now, we’re going to visualize the source of tickets as a cloud, which represents a system boundary. Put another way, when you see a cloud at a system boundary, we’re saying, “we’re not thinking too hard about this part of the system right now”. All system models are imperfect representations of the real world, so it’s helpful to have visual cues that correspond to the boundaries of your system. In this case, we’re using clouds.
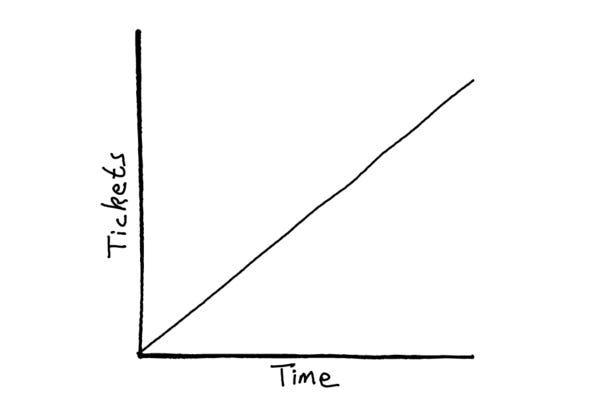
Now, if we were to graph out what this system above looks like, we’d get tickets going up and to the right and never coming down. There are lots of times in business we want our graphs to go up and to the right, but this is not one of them! This is what would happen if you let the stock of tickets increase but didn’t have a way to decrease the stock, i.e. “nobody is in the queue.”
Oops
Flow
The way a stock changes over time is by adding a flow, that is, something that has the power to change the level of the stock.
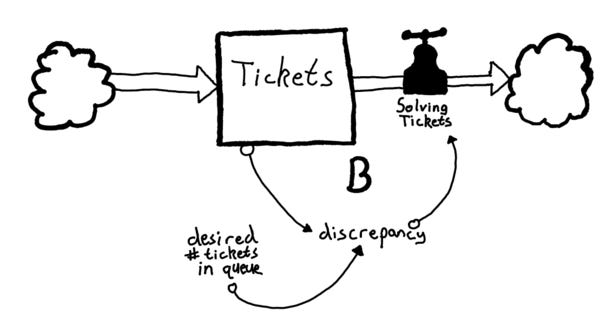
In the image above, you’ll notice we’ve added a flow for “solving tickets”, as well as a cloud for a system boundary, which represents “wherever tickets go when they are solved.” Think of the flow as a valve. When the valve is on, tickets flow through, and when the valve is off—like when a solo agent goes home at the end of the day—the stock of tickets increases.
The above graph might represent what you’d see if you showed up to a busy queue on Monday and weren’t able to get to inbox zero until Thursday.
Balancing feedback loop
One thing missing from our system is how we know to turn the flow of “solving tickets” on or off. I mentioned “inbox zero” above, but it hasn’t yet been modeled in the system. “Inbox zero” is part of a balancing feedback loop that seeks to drive the stock of support tickets to a particular level, in this case, zero.
In the above model, as long as there’s a discrepancy between the actual number of tickets in the queue and the desired number of tickets in the queue, the flow of “solving tickets” will be open and tickets will be solved.
Why show the balancing feedback loop? Isn’t the flow always “on” and therefore trying to solve tickets? Not necessarily. If you get to inbox zero, you can turn the valve off and presumably let your solo agent go work on other things (like extra-queue-rricular work).
The value of modeling systems
Hopefully by now you’re starting to see the value in modeling the support system. You can see how in the spreadsheet model we looked at last week for hiring agents, we’re talking about changing the rate of flow (more agents = higher rate of flow of tickets through the system). But flow isn’t the only part of the system that can change.
Perhaps you’re wondering what happens when you start exploring the edges of the system boundary (how do those tickets get in there, anyway?), or maybe you wonder what happens if you change the indicator for the balancing feedback loop (what if we used an SLA-based approach instead of inbox zero?). When you can visualize and understand the stocks, flows, and feedback loops within a system, you find more opportunities to change the system.
In coming weeks, we’ll move beyond my crude drawings and bad handwriting and start dynamically modeling systems. Okay, okay, I’ll probably continue with the crude drawings and bad handwriting, but we’ll also go beyond spreadsheets and start bringing these systems to life.
The next post in this series is Modeling the Support System in HASH.


